Getting Familiar with Ghidra
Following up from my previous blog of “My Beginnings with Assembly”, I’ve been continuing to deep dive into malware analysis and reverse engineering. Using Ghidra for performing analysis, combined with the knowledge of reading and writing Assembly language enables is useful for performing an end-to-end investigation for potential attacks.
Ghidra is an open source tool created by the National Security Agency (NSA), and is designed automate reverse engineering tasks for researchers and analysts.
Getting started with Ghidra is pretty straightforward. Once downloaded, you create a new Project, and you’re able to begin uploading samples directly to the tool. I used some sample malware to demonstrate what it looks like once you upload samples and begin the investigation.
Note: I’m running this on a virtual machine, that’s not connected to the internet or my host machine. Doing malware analysis on a main system is not advised! You may need to recreate the box at any time, and doing so on a main system would be ill-advised.

Ghidra Import Results Summary
The following overview screen pops up when you add a sample to Ghidra. I’ve highlighted some of the interesting bits here, specifically:
- What architecture that the sample was built for (Compiler ID and Processor)
- How many functions were found (# of Functions)
- Hash information (Executable MD5 and Executable SHA256)
Once the sample is uploaded, I analyzed it using the default settings. From there, I see an entry function and other similar named functions:
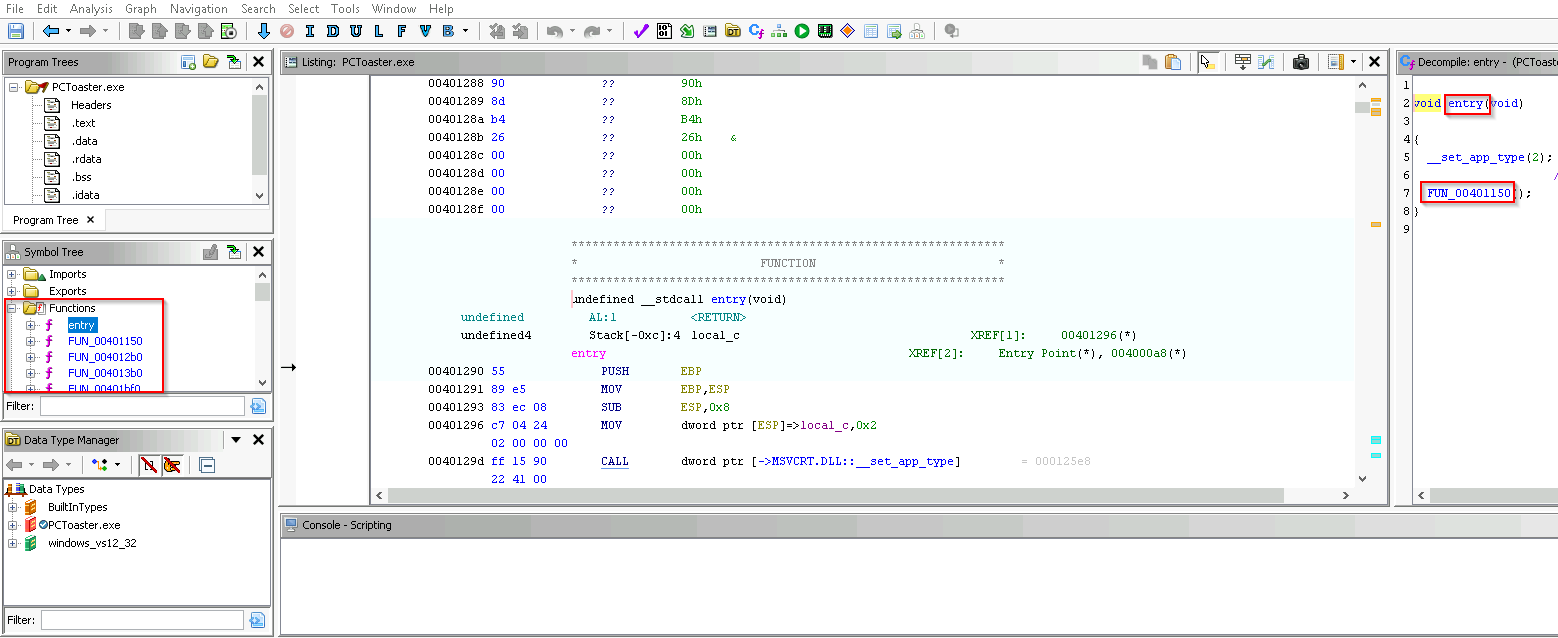
Ghidra CodeBrowser View
There’s an `entry` function defined, which is a good place to start investigating what’s going on with this sample. In samples, you may find an `entry` or `main` function within. However, that may not be the actual “main” function you’re looking for, and additional analysis is required. As you can see on the right side of the screenshot above, there’s not much within the decompile view, and we need to dive deeper into the functions found.
Additionally, the function names don’t really tell us a lot about what’s going on with the program. There’s generically named (prefixes of “FUN_” and the address they’re located at), which means they either didn’t have debugging information on during the time they were compiled, or the headers were proactively stripped after compilation.
From here, there’s a couple neat tricks I used within Ghidra to help perform the analysis. First, there’s a feature to enable “Function Call Trees”, under the “Window” tab:

Function Call Trees option in Ghidra
This gives a better view to follow along with the calls being made to and from each function.
Next, I can use the ability to rename functions by right-clicking on a function name:
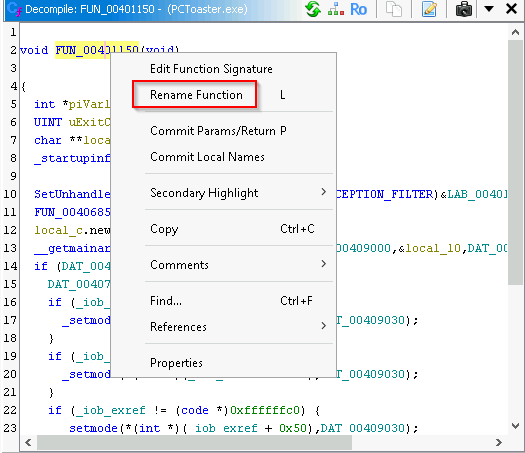
Rename Function option within Ghidra
This will enable me to appropriately rename the function throughout the analysis in Ghidra as I’m examining the sample. In this case, this function looks to initialize additional functions as well as set up exception handling and passing command line arguments, potentially as a startup function.
As such, I’ll rename this function to “startRoutine”, and put all of the above together:

Renamed Function and Function Call Tree within Ghidra
I can see my renamed function listed in the list of functions now, as well as what the incoming and outgoing function calls are. I can continue to follow along with additional functions being called here to learn more about how the sample behaves and for any malicious activity.
This was just a short walkthrough of Ghidra and some of its features. Ghidra has a lot of functionality, and might be a bit intimidating for some who haven’t used it before. These tips were some of the things that helped it click for me to be more comfortable performing sample analysis.
I’m curious of any other tips folks have or other details you would want to see!